
WYNDHAM HOTELS & RESORTS REPORTS STRONG FOURTH QUARTER RESULTS WITH RECORD OPENINGS, RETENTION AND SYSTEM GROWTH
Increases Quarterly Dividend by 9%; Reiterates Full-Year 2024 Outlook. |
|
WYNDHAM HOTELS & RESORTS REPORTS STRONG FOURTH QUARTER RESULTS WITH RECORD OPENINGS, RETENTION AND SYSTEM GROWTH
Increases Quarterly Dividend by 9%; Reiterates Full-Year 2024 Outlook. |
Category: Worldwide - Industry economy -
Figures / Studies
This is a press release selected by our editorial committee and published online for free on 2024-02-16
Wyndham Hotels & Resorts (NYSE: WH) today announced results for the three months and year ended December 31, 2023.
Highlights include:
- System-wide rooms grew organically by 3.5% year-over-year, a record high.
- Opened a record 66,000 organic rooms, representing a year-over-year increase of 3%.
- Global retention rate – including all terminations – improved another 30 basis points to a record 95.6%.
- Development pipeline grew 1% sequentially and by 10% year-over-year to a record 240,000 rooms.
- Grew ECHO Suites pipeline nearly 60% year-over-year with 98 new contract signings.
- Signed 766 contracts for legacy brands, an increase of 8% year-over-year.
- Fourth quarter diluted earnings per share of $0.60 and net income of $50 million; adjusted diluted EPS of $0.91, adjusted net income of $75 million and adjusted EBITDA of $154 million.
- Full-year 2023 diluted EPS of $3.41 and net income of $289 million; adjusted diluted EPS of $4.01, adjusted net income of $341 million and adjusted EBITDA of $659 million.
- Net cash provided by operating activities of $376 million and free cash flow of $339 million for the full-year.
- Returned $515 million to shareholders for the full-year through $397 million of share repurchases and quarterly cash dividends of $0.35 per share.
- Board of Directors recently authorized a 9% increase in the quarterly cash dividend to $0.38 per share beginning with the dividend expected to be declared in first quarter 2024.
“We are tremendously proud to report fourth quarter results that demonstrate the continued success of our global strategy and our accelerating momentum,” said Geoff Ballotti, president and chief executive officer. “Despite the distraction, uncertainty and misperceptions caused by Choice and their slanted and constant communications to our franchisee base, room openings accelerated and our global development pipeline grew by 10% to an all-time high of 240,000 rooms. Our team opened 27% more rooms than last year in the fourth quarter and we welcomed 500 new hotels to our system in 2023. This, when combined with our improving franchisee engagement and record retention rate, drove the best organic system growth we’ve ever achieved. We grew comparable adjusted EBITDA by 6% and returned over half a billion dollars to our shareholders through dividends and share repurchases. We are confident in the continued effectiveness of our growth strategy and see exceptional value-creation opportunities in the years ahead.”
System Size and Development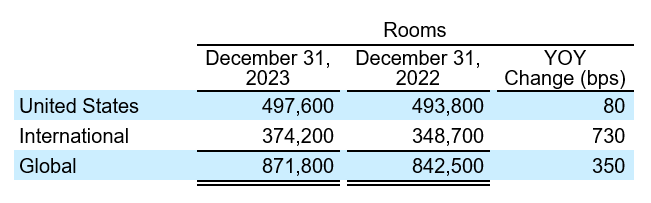
The Company’s global system grew 3.5%, marking 12 consecutive quarters of organic growth and reflecting 1% growth in the U.S. and 7% internationally.
As expected, these increases included strong growth in both the higher RevPAR midscale and above segments in the U.S. and the direct franchising business in China, which grew 3% and 13%, respectively.
The Company also increased its retention rate, which includes all terminations, by another 30 basis points year-over-year, ending the year at a record 95.6%.
On December 31, 2023, the Company’s global development pipeline consisted of over 1,950 hotels and approximately 240,000 rooms, representing another record-high level and a 10% year-over-year increase.
Key highlights include:
- 14th consecutive quarter of sequential pipeline growth
- 8% growth in the U.S. and 11% internationally
- Approximately 70% of the pipeline is in the midscale and above segments, which grew 6% year-over-year
- Approximately 58% of the pipeline is international
- Approximately 79% of the pipeline is new construction, of which approximately 34% has broken ground
- The Company awarded 766 new contracts for its legacy brands in full-year 2023, an increase of 8% compared to full-year 2022. Additionally, the Company awarded 98 additional new contracts for its ECHO Suites brand and, as of December 31, 2023, the Company had awarded 268 contracts, or over 33,000 rooms, for the brand.
RevPAR
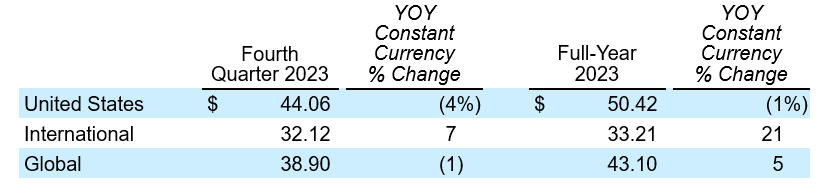
Fourth quarter global RevPAR declined 1% in constant currency compared to 2022 reflecting a 4% decline in the U.S. and growth of 7% internationally.
For the full year, global RevPAR grew 5% in constant currency compared to 2022 reflecting a 1% decline in the U.S. and growth of 21% internationally.
The Company had achieved record-breaking RevPAR in the U.S. during the preceding year due to COVID-impacted travel patterns.
Comparing to 2019 to neutralize for COVID-impacted travel patterns, U.S. RevPAR grew 10% in fourth quarter – a 120 basis point acceleration from third quarter 2023 growth – and 9% for the full year.
Internationally, year-over-year RevPAR growth for both the fourth quarter and the full-year was primarily driven by higher occupancy levels. Compared to 2019, international RevPAR grew in fourth quarter and full-year by 44% and 36%, respectively, on a constant-currency basis.
Operating Results
Fourth Quarter
- Fee-related and other revenues was $320 million compared to $310 million in fourth quarter 2022 reflecting global net room growth as well as higher license and ancillary fees.
- The Company generated net income of $50 million compared to $56 million in fourth quarter 2022. The decrease was reflective of a higher effective tax rate, higher interest expense, foreign currency impact from hyper-inflation in Argentina and transaction-related expenses resulting from the unsolicited offer by Choice Hotels, partially offset by higher adjusted EBITDA.
- Adjusted EBITDA grew 22% to $154 million from $126 million. This increase included a $21 million favorable impact from marketing fund variability, excluding which adjusted EBITDA grew 6% primarily reflecting higher fee-related and other revenues.
- Diluted earnings per share was $0.60 compared to $0.63 in fourth quarter 2022. This decrease reflects lower net income, partially offset by the benefit of a lower share count due to share repurchase activity.
- Adjusted diluted EPS grew 26% to $0.91 per share from $0.72 per share. This increase included $0.19 per share related to the favorable marketing fund variability (after estimated taxes), excluding which adjusted diluted EPS was unchanged year-over-year as adjusted EBITDA growth and the benefit from share repurchase activity was substantially offset by higher interest expense.
- During fourth quarter 2023, the Company’s marketing fund revenues exceeded expenses by $9 million; while in fourth quarter 2022, the Company’s marketing fund expenses exceeded revenues by $12 million, resulting in $21 million of marketing fund variability.
Full Year
- Fee-related and other revenues was $1,384 million compared to $1,354 million in full-year 2022, which included $50 million from the Company’s select service management business and owned hotels, which were exited in 2022. On a comparable basis, fee-related and other revenues increased 6% year-over-year primarily reflecting global RevPAR and net room growth, higher license and ancillary fees and pass-through revenues associated with the Company’s global franchisee conference in September, which was held for the first time since 2019.
- The Company generated net income of $289 million compared to $355 million in full-year 2022, which included $37 million from the select-service managed and owned hotels. The decrease was reflective of a higher effective tax rate, higher interest expense, foreign currency impact from hyper-inflation in Argentina and transaction-related expenses resulting from the unsolicited offer by Choice Hotels, partially offset by higher adjusted EBITDA.
- Adjusted EBITDA was $659 million compared to $650 million in full-year 2022, which included $18 million from the select-service managed and owned hotels. The growth in adjusted EBITDA was further impacted by $11 million of unfavorable marketing fund variability. On a comparable basis, adjusted EBITDA increased 6% reflecting higher fee-related and other revenues.
- Diluted earnings per share was $3.41 compared to $3.91 in full-year 2022, which included $0.40 per share from the select-service managed and owned hotels. This decrease reflects the lower net income, partially offset by the benefit of a lower share count due to share repurchase activity.
- Adjusted diluted EPS was $4.01 per share compared to $3.96 per share in full-year 2022, which included $0.15 per share from the select-service managed and owned hotels. This growth in adjusted diluted EPS was further impacted by $0.09 per share (after estimated taxes) of unfavorable marketing fund variability. On a comparable basis, adjusted diluted EPS increased 8% year-over-year reflecting the adjusted EBITDA growth and the benefit from share repurchase activity, partially offset by higher interest expense.
- During full-year 2023, the Company’s marketing fund revenues exceeded expenses by $9 million; while in 2022, the Company’s marketing fund revenues exceeded expenses by $20 million, resulting in $11 million of marketing fund variability.
Full reconciliations of GAAP results to the Company’s non-GAAP adjusted measures for all reported periods appear in the tables to this press release.
Balance Sheet and Liquidity
The Company generated $376 million of net cash provided by operating activities and free cash flow of $339 million in the full-year 2023. The Company ended the quarter with a cash balance of $66 million and approximately $650 million in total liquidity.
The Company’s net debt leverage ratio was 3.2 times at December 31, 2023, within the lower half of the Company’s 3 to 4 times stated target range.
Share Repurchases and Dividends
During the fourth quarter, the Company repurchased approximately 1.7 million shares of its common stock for $127 million. For the full-year 2023, the Company repurchased approximately 5.5 million shares of its common stock for $397 million, at an average price of $72.25, 8% lower than trading levels as of February 13th.
The Company paid common stock dividends of $28 million, or $0.35 per share, in the fourth quarter of 2023 for a total of $118 million, or $1.40 per share, for the full-year 2023.
For the full-year 2023, the Company returned $515 million to shareholders through share repurchases and quarterly cash dividends.
The Company’s Board of Directors authorized a 9% increase in the quarterly cash dividend to $0.38 per share, beginning with the dividend expected to be declared in first quarter 2024.
Full-Year 2024 Outlook
The Company provided the following outlook for full-year 2024:
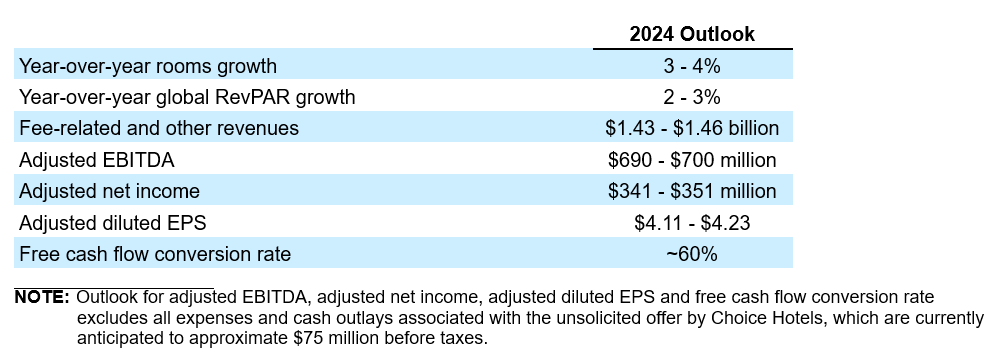
Year-over-year growth rates for adjusted EBITDA, adjusted net income and adjusted diluted EPS are not comparable due to full-year 2023 marketing fund revenues exceeding expenses by $9 million, which substantially completed the recovery of the $49 million support the Company provided to its owners during COVID. The Company expects marketing revenues to equal expenses during full-year 2024 though seasonality of spend will affect the quarterly comparisons throughout the year.
More detailed projections are available in Table 8 of this press release. The Company is providing certain financial metrics only on a non-GAAP basis because, without unreasonable efforts, it is unable to predict with reasonable certainty the occurrence or amount of all of the adjustments or other potential adjustments that may arise in the future during the forward-looking period, which can be dependent on future events that may not be reliably predicted. Based on past reported results, where one or more of these items have been applicable, such excluded items could be material, individually or in the aggregate, to the reported results.
Conference Call Information
Wyndham Hotels will hold a conference call with investors to discuss the Company’s results and outlook on Thursday, February 15, 2024 at 8:30 a.m. ET.
Listeners can access the webcast live through the Company’s website at https://investor.wyndhamhotels.com. The conference call may also be accessed by dialing 800 225-9448 and providing the passcode “Wyndham”. Listeners are urged to call at least five minutes prior to the scheduled start time.
An archive of this webcast will be available on the website beginning at noon ET on February 15, 2024. A telephone replay will be available for approximately ten days beginning at noon ET on February 15, 2024 at 800 839-9719.
Presentation of Financial Information
Financial information discussed in this press release includes non-GAAP measures, which include or exclude certain items. These non-GAAP measures differ from reported GAAP results and are intended to illustrate what management believes are relevant period-over-period comparisons and are helpful to investors as an additional tool for further understanding and assessing the Company’s ongoing operating performance.
The Company uses these measures internally to assess its operating performance, both absolutely and in comparison to other companies, and to make day to day operating decisions, including in the evaluation of selected compensation decisions.
Exclusion of items in the Company’s non-GAAP presentation should not be considered an inference that these items are unusual, infrequent or non-recurring.
Full reconciliations of GAAP results to the comparable non-GAAP measures for the reported periods appear in the financial tables section of this press release.
About Wyndham Hotels & Resorts
Wyndham Hotels & Resorts (NYSE: WH) is the world’s largest hotel franchising company by the number of properties, with approximately 9,200 hotels across over 95 countries on six continents. Through its network of approximately 872,000 rooms appealing to the everyday traveler, Wyndham commands a leading presence in the economy and midscale segments of the lodging industry. The Company operates a portfolio of 24 hotel brands, including Super 8, Days Inn, Ramada, Microtel, La Quinta, Baymont, Wingate, AmericInn, Hawthorn Suites, Trademark Collection and Wyndham. The Company’s award-winning Wyndham Rewards loyalty program offers over 106 million enrolled members the opportunity to redeem points at thousands of hotels, vacation club resorts and vacation rentals globally. The Company may use its website as a means of disclosing material non-public information and for complying with its disclosure obligations under Regulation FD. Disclosures of this nature will be included on the Company’s website in the Investors section, which can currently be accessed at www.investor.wyndhamhotels.com. Accordingly, investors should monitor this section of the Company’s website in addition to following the Company’s press releases, filings submitted with the Securities and Exchange Commission and any public conference calls or webcasts.
|
|


